01 - CODINGAME DEVELOPER SURVEY 2020
02 - INDEX
03 - INTRODUCTION
04 - LEARN TO CODE, CODE TO LEARN
05 - LEARNING TO CODE
06 - EDUCATION AND QUALIFICATIONS
07 - DEVELOPERS AT SCHOOL
08 - KEEPING UP TO SCRATCH
09 - LEARNING IS DOING
10 - TRENDING IN 2020
11 - PROGRAMMING LANGUAGES AND TECHNOLOGIES
12 - BEST-KNOWN FRAMEWORKS
13 - BEST-KNOWN PROGRAMMING LANGUAGES
14 - MOST-LOVED PROGRAMMING LANGUAGES
15 - MOST-DREADED PROGRAMMING LANGUAGES
16 - DEVELOPERS, WORK & HAPPINESS
17 - DEVELOPERS LOVE WHAT THEY DO
18 - EDUCATION AND PROFESSIONAL FULFILMENT
19 - CODING QUALIFICATIONS
20 - WHERE ARE DEVELOPERS HAPPIEST
21 - DEVELOPER HAPPINESS & INDUSTRY
22 - DEVELOPER HAPPINESS & POSITION
23 - COMMUNITY DEMOGRAPHICS
24 - AGE & GENDER
25 - DEVELOPERS ACROSS THE GLOBE
26 - EMPLOYMENT STATUS
27 - EXPERIENCE AND COMPANY SIZE
28 - POSITION AND INDUSTRY
29 - THE END

CODINGAME 2020 DEVELOPER SURVEY REPORT

INTRODUCTION

Here at CodinGame, we know developers. We know what they want and what they (really) don’t.

With CodinGame.com, we provide coders with everything they need to perfect their skills, learn new ones, have fun (#obvs) – and even land a cool job.

With our tech recruitment platform, CodinGame for Work, we’re paving the way for skill-based hiring. Good jobs for good programmers – no matter their educational, professional or social background.

But enough about us, let’s get stuck into the results. We surveyed over 20,000 developers from all over the world to bring you this report.

We found out all sorts of interesting stuff, such as:

  • Close to 35% of developers consider themselves to be self-taught
  • 1 in 3 developers code for more than an hour a day outside of work or school
  • The United Kingdom is home to the happiest developers in the world

Want to know more? Read on.

01 - Learn to code, code to learn

How do developers learn to code?

The majority of developers (58.2%) learn to code either at university or at school. However, close to 35% (34.6%) consider themselves to be self-taught. Although more than 1 in 3 developers learnt to code all on their own (thanks to the free and handy resources out there: tutorials, books, YouTube, etc.) none of them consider that they simply learnt “on the job”.

I went to university
42.66%
I'm self-taught (free online and offline resources)
34.61%
I learnt at school (pre-university)
15.45%
I followed a short-term offline training program (bootcamp, training courses)
5.07% 5.07%
I followed an online training course (MOOC)
2.21% 2.21%
I learnt "on the job"
0

Education and qualifications

The majority of developers have gone on to achieve a higher level of education: 54.8% of them hold either a Master’s or a Bachelor’s degree (2% even have a PhD!). 

This is very cool. However, formal education isn’t the only path to developer greatness. In fact, 21.7% of developers say they don’t have any formal qualifications. It’s what you know that counts!

What is your current level of qualification?

I have a Master's degree
28.2%
I have a Bachelor's degree
26.56%
I don't have a formal qualification
21.67%
I have a three-year higher education qualification
11.18%
I have a two-year higher education qualification
10.37%
I have a PhD
2.02% 2.02%

What did
developers study?

Those who do have a formal qualification generally studied computer science. Go figure, huh? 

Obvious as that seems, a whole bunch of developers (close to 10%) studied something else entirely: business, architecture, marketing, philosophy and more!

What field is your qualification in?

Computer science
76.40%
Other sciences (maths, aerospace, chemistry, physics, etc.)
13.64%
Something else entirely
9.96%

Coding and keeping up to scratch

Coding, like learning a foreign language or
French cuisine, is a continuous learning
journey. Developers are always perfecting
their skills and learning new ones.

A massive 64.9% say they devour online
written tutorials (blogs, official documentation,
etc.).


YouTube is also a popular go-to for developers
hungry for knowledge. 60.8% of developers
state it as their favorite medium to improve
their coding skills or learn new ones.


What’s more (and we’re particularly pleased to
read this!), over half of developers hone their
skills on competitive programming platforms
like CodinGame.
Online written tutorials (blogs, official documentation, etc.)
64.86%
YouTube
60.77%
Online competitive programming platforms like CodinGame
50.92%
Online educational platforms & MOOCS
46.80%
Tech books
39.41%
Open source project contributions
25.74%
Traditional offline courses
15.39%
Other
7.39%

Learning is doing, right?

Well, the vast majority of developers (69.7%) think so.

Not only do programmers keep up to scratch thanks to various resources, they also keep their coding skills up to date by doing (well, coding).

1 in 3 developers say they code for more than an hour a day outside of work or school.

What are developers excited about learning this year?

The top three things developers would like to learn more about in 2020 are: Machine Learning/AI (49.2%), Game development (35.4%) and Web development (33.1%).

ANSWER CHOICES
RESPONSES
Machine Learning/AI
49.17%
Game Development
35.43%
Web Development
33.14%
Mobile Development
26.04%
Functional Programming
25.49%
Big Data
24.88%
Cybersecurity
22.37%
DevOps
22.20%
UI/UX Design
19.72%
Internet of Things (IoT)
19.04%
Robotics
14.73%
Virtual Reality
14.24%
Blockchain
13.91%
Business Intelligence
9.14%
Growth Hacking
8.89%
Other
4.49%

02 - PROGRAMMING LANGUAGES AND TECHNOLOGIES: WHAT’S TRENDING?

Can you guess the best-known frameworks in 2020?

Node.js, React and .NETCore make the top
three, closely followed by AngularJS and
Spring.
ANSWER CHOICES
RESPONSES
Node.js
35.76%
React
23.80%
.NETCore
22.82%
Other
21.38%
AngularJS
20.26%
Spring
18.48%
Angular 2+
16.67%
Django
15.55%
ExpressJS
14.41%
Vue.js
14.26%
ASP
12.17%
Flask
10.17%
Symfony
9.82%
Laravel
9.71%
React Native
8.40%
JSF
5.73%
Struts
3.54%
RoR
2.98%
Play
2.86%
Backbone.js
2.70%
Cocoa
2.41%
ExtJS
1.91%
Meteor
1.72%
Ember
1.43%
Pyramid
1.23%
RubyMotion
1.07%
Padrino
0.55%

Which programming languages do developers know best?

Javascript, Java, Python and C++ are the
best-known programming languages: over
half of our respondents answered that
they know how to code in these
languages.


However, rare are the developers who
know how to code in Clojure, F# or
OCaml.
ANSWER CHOICES
RESPONSES
Javascript
65.46%
Java
62.74%
Python
57.13%
C++
51.73%
C
49.58%
C#
42.92%
PHP
39.10%
Bash
26.73%
VB.NET
11.54%
Other
10.33%
Pascal/Delphi
8.62%
Ruby
7.81%
Go
7.02%
Lua
6.86%
Kotlin
6.82%
Perl
5.25%
Swift
4.69%
Scala
4.26%
Haskell
4.02%
Rust
3.75%
ObjectiveC
3.66%
Groovy
3.33%
Dart
2.98%
OCaml
2.95%
F#
1.58%
Clojure
1.08%

Developers' most-loved programming languages

It’s no wonder that Python, Javascript and Java are in the top three of best-known programming languages – it’s because developers can’t get enough of them! They’re the most-loved coding languages.

Special mention for Python, in top position for the third year in a row. The language has truly captured developers’ hearts.

ANSWER CHOICES
RESPONSES
Python
35.97%
Javascript
29.48%
Java
29.10%
C#
24.98%
C++
24.26%
C
13.15%
PHP
11.47%
Other
4.96%
Bash
4.12%
Kotlin
3.94%
Go
3.84%
Rust
3.25%
Ruby
2.82%
Swift
2.30%
Haskell
1.92%
Scala
1.87%
VB.NET
1.60%
Lua
1.30%
Dart
1.21%
Pascal/Delphi
0.89%
OCami
0.75%
Perl
0.75%
Clojure
0.73%
F#
0.70%
Groovy
0.57%
ObjectiveC
0.57%

Developers' most-dreaded programming languages

Oh! There’s Java and Javascript again!
These two programming languages seem to divide developers: they either hate em’ or they love em’. The languages are cited both as two of the most-loved and most-hated languages.

There’s one language, however, that everyone agrees on – and that’s PHP. PHP is recognized, yet again, as developers’ most-dreaded language.

ANSWER CHOICES
RESPONSES
PHP
25.10%
Java
23.93%
Javascript
21.29%
VB.NET
17.27%
C
15.44%
C++
13.74%
Bash
9.55%
C#
8.84%
Python
8.39%
Pascal/Delphi
7.68%
ObjectiveC
7.51%
Perl
6.95%
Other
6.19%
Ruby
4.77%
Haskell
3.71%
Swift
3.59%
Lua
2.88%
OCami
2.84%
F#
2.77%
Scala
2.75%
Go
2.68%
Clojure
2.34%
Groovy
2.25%
Kotlin
2.12%
Rust
1.78%
Dart
1.60%

03 - Developers, work & happiness

Developers love what they do

When asked, on a scale of 0 to 10, how much they enjoy their job, 66.4% of respondents answered between 7 and 10.

7.0 average rating
7/10

On a scale of 0 to 10, do you enjoy your current job? 0: I hate my job; 10: I adore by job!

Education and professional fulfilment in coding

As we’ve mentioned before, higher education and formal qualifications aren’t the only path to developer success and fulfilment.

In fact, developers are happy at work regardless of whether or not they learnt to code in a formal setting.

For example, self-taught developers rate their happiness at 6.94 out of 10, whereas developers who went to university give an average mark of 6.91.

I learnt at school (pre-university)
7.08
I followed a short-term office training program (bootcamp, short training course)
7.03
I followed an online training course (MOOC)
6.97
I'm self-taught (free online and offline resources: tutorials, books, YouTube, etc.)
6.94
I went to university
6.91

Qualifications and professional fulfilment in coding

Along the same lines: developers who don’t have a formal qualification rate their happiness at work at 7.10 out of 10, whereas developers with a Master’s degree give an average mark of 6.96.

The moral of the story, we think, is that you can become a fulfilled programmer no matter your educational background.

I have a PhD
7.22
I don't have a formal qualification
7.10
I have a three-year higher education qualification
6.99
I have a two-year higher education qualification
6.97
I have a Master's degree
6.96
I have a Bachelor's degree
6.84

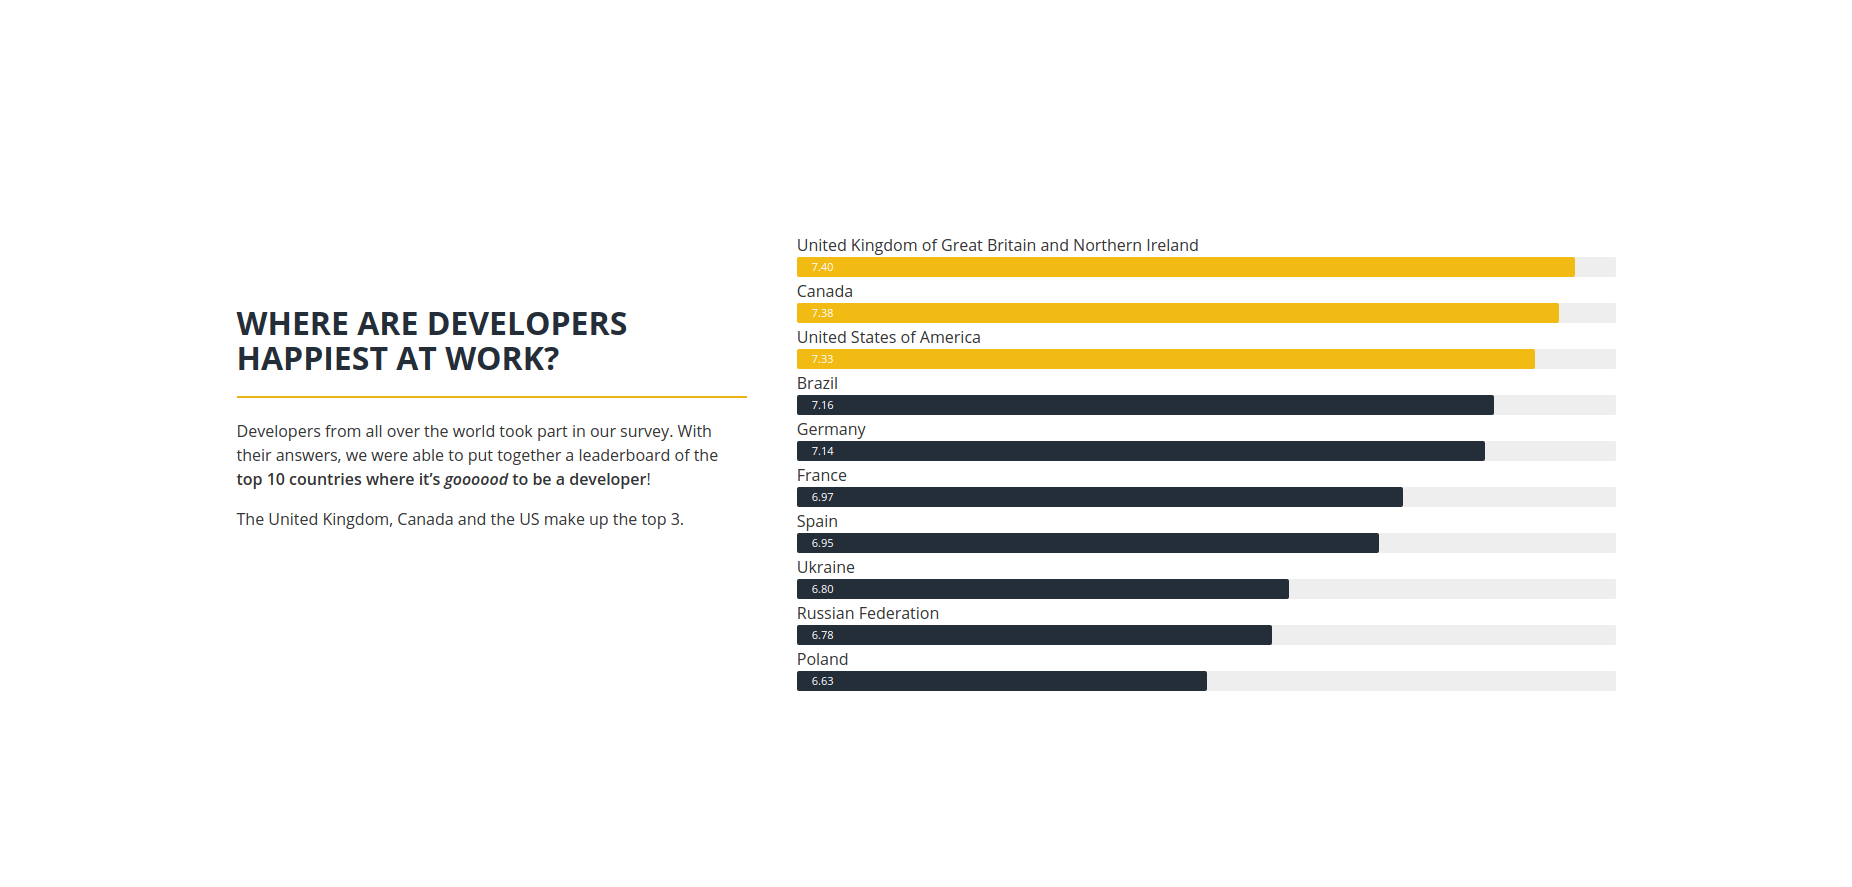
Where are developers happiest at work?

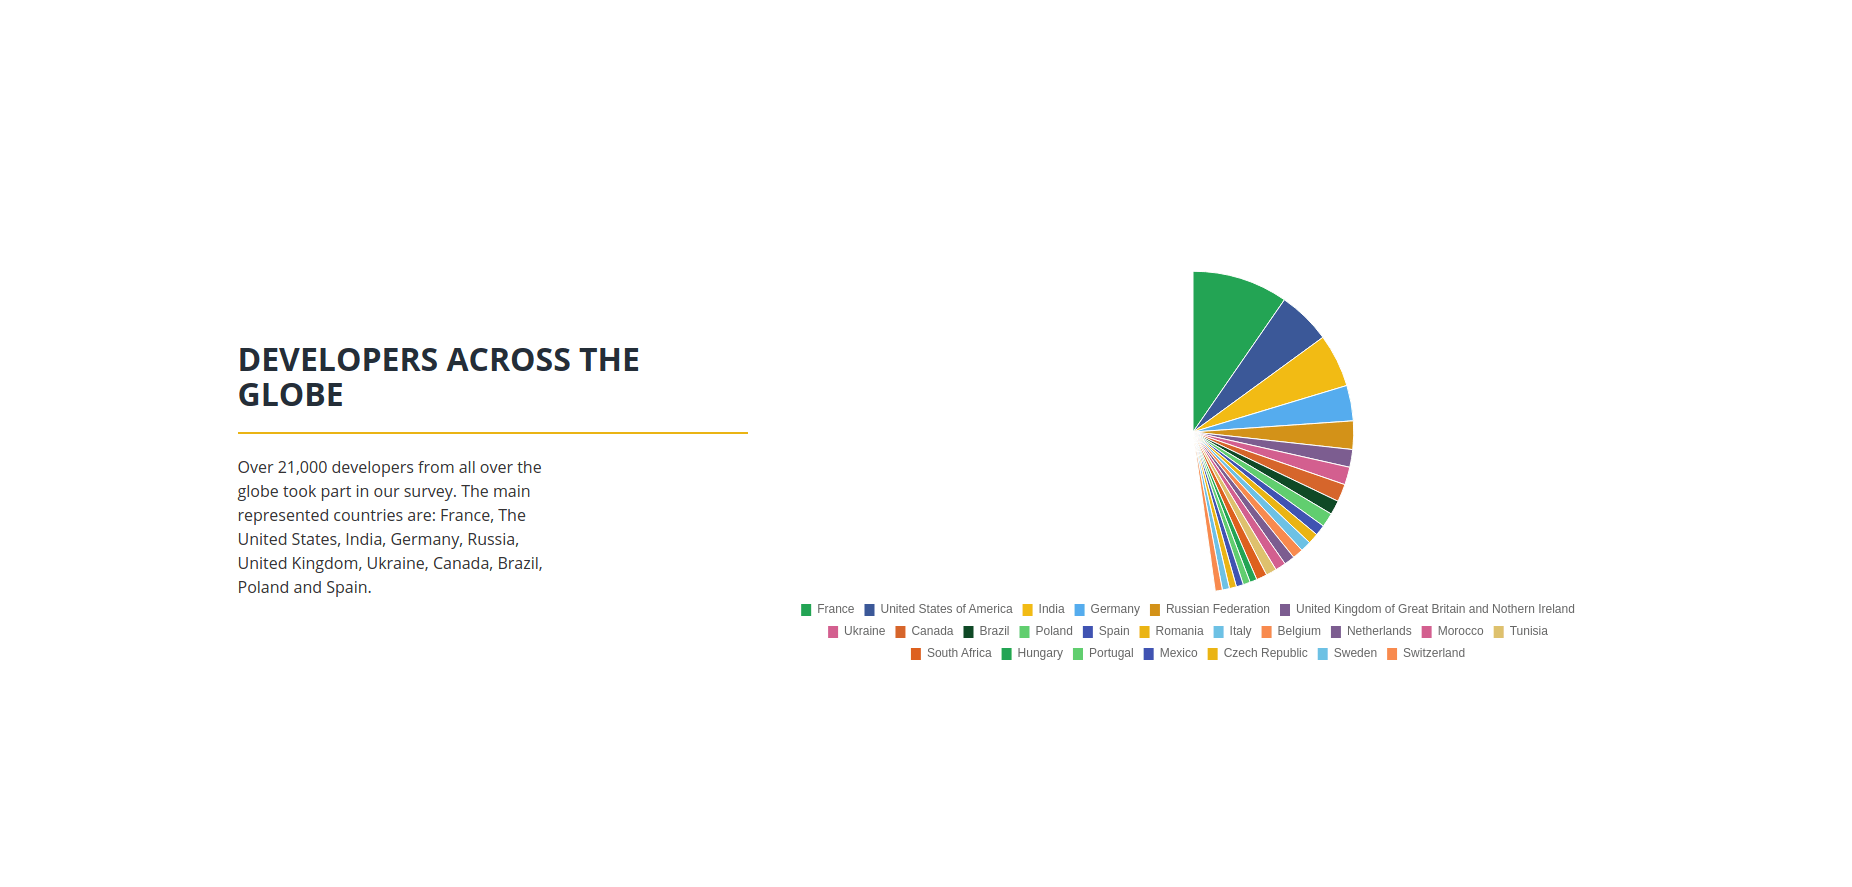
Developers from all over the world took part in our survey. With their answers, we were able to put together a leaderboard of the top 10 countries where it’s goooood to be a developer!

The United Kingdom, Canada and the US make up the top 3.

United Kingdom of Great Britain and Northern Ireland
7.40
Canada
7.38
United States of America
7.33
Brazil
7.16
Germany
7.14
France
6.97
Spain
6.95
Ukraine
6.80
Russian Federation
6.78
Poland
6.63

In which industries are developers happiest?

Developers work in all kinds of industries: from IT services to Retail or Healthcare.

We’ve put together a leaderboard of the top 10 industries where developers are happiest.

The gold medal goes to the Technology industry. Silver and bronze go to the Media and Education industries.

Technology
7.29
Media
7.28
Education
7.22
Energy
7.03
Healthcare
7.00
IT services
6.94
Insurance
6.79
Finance
6.76
Aerospace
6.57
Manufacturing
6.37

Which positions are developers happiest in?

We found that the happiest developers are data scientists and game developers.

What’s more, we’re thrilled to see that teachers, trainers and educators also love what they do. True, how empowering to pass on your programming know-how!

We’re glad to see that the world’s future coders are in the hands of people who are passionate about what they do.

Data scientist or machine learning specialist
7.30
Game developer/engineer
7.29
Teacher, educator, trainer or academic researcher
7.23
Architect
7.15
Full-stack developer/engineer
7.12
DevOps
7.09
Front-end developer/engineer
7.05
Software developer/engineer
6.91
Back-end developer/engineer
6.90
Mobile developer/engineer
6.85

04 - COMMUNITY DEMOGRAPHICS

Developer community: age and gender

The majority of our respondents (64.09%) are between 20 and 34 years old.

Close to 90% of our respondents identify as “male”.

However, the proportion of women who took part in our survey has progressed from 6% (2 years ago) to 8.7% (last year) to 11.5% this year.

Baby steps in the right direction.

Developers across the globe

Over 21,000 developers from all over the
globe took part in our survey. The main
represented countries are: France, The
United States, India, Germany, Russia,
United Kingdom, Ukraine, Canada, Brazil,
Poland and Spain.

Employment status

50.1% of respondents are employed full-time.

Students represent 31.3% of participants, whereas job seekers only represent 8.3%.

Overall, active professional developers make up over 60% of our community.

Employed full-time
50.13%
Student
31.34%
Unemployed
8.25%
Freelancer or self-employed
7.52% 7.52%
Employed part-time
2.76% 2.76%
Unemployed, not looking for work
2.76% 0%

EXPERIENCE AND COMPANY SIZE

Senior developers (over 5 years of experience) represent
38.8% of respondents, whereas Junior developers (less than
3 years of professional experience) represent 43%.
32.3% of respondents work in a company with over 1000
employees. Companies with 50-249 employees come
next, representing 21.5% of respondents.
 
Small companies and startups with less than 10 employees
represent 8.5% of respondents.
0-1 year
19.33%
2-3 years
23.65%
4-5 years
15.18%
6-7 years
9.26%
10-11 years
6.56% 6.56%
12-15 years
8.97% 8.97%
16-20 years
5.18% 5.18%
Over 20
5.51% 5.51%
Over 1000 employees
32.30%
50-249 employees
21.45%
10-49 employees
20.40%
250-999 employees
16.08%
1-9 employees
8.5%
I don't work for a company
1.28% 1.28%
8-9 years
6.36% 6.36%

Position and industry

The most frequent position among respondents was
Full-stack developer” (24.6%), followed by “Software
developer” (20.3%) and “Back-end developer” (12.9%).
22.9% of respondents work in the “IT services” industry,
followed by “Technology” (13.5%) and “Finance” (9.2%).
10.7% of respondents chose to describe their industry
as “Other”. Answers included Marketing, Transportation
and Entertainment.
ANSWER CHOICES
RESPONSES
Full-stack developer/engineer
24.59%
Software developer/engineer
20.29%
Back-end developer/engineer
12.92%
Applications developer
6.50%
Front-end developer/engineer
6.19%
Architect
3.51%
Game developer/engineer
3.49%
Other
3.11%
Embedded software engineer
2.54%
DevOps
2.21%
Teacher, educator, trainer or academic researcher
2.17%
Mobile Developer/engineer
2.11%
Data scientist or machine learning specialist
1.76%
Tester/Test engineering analyst
1.67%
CTO
1.51%
Project manager
1.29%
Data or business analyst
1.05%
Systems engineer
0.92%
Sysadmin
0.90%
CEO
0.57%
Product manager
0.50%
DBA
0.22%
Job seeker
0.00%
ANSWER CHOICES
RESPONSES
IT services
22.91%
Technology
13.45%
Other (please specify)
10.86%
Finance
9.24%
I don’t work in one particular industry
8.78%
Healthcare
4.13%
Education
3.93%
Media
3.82%
Telecommunications
3.71%
Retail
3.29%
Manufacturing
2.54%
Aerospace
2.50%
Energy
2.33%
Public administration
1.86%
Insurance
1.82%
Security
1.47%
Construction
0.85%
Real estate
0.85%
Agriculture
0.83%
Hardware
0.83%
Beauty
0.18%

LOVED IT? SHARE IT!

We’d love for you to share our work with the world and empower people to get a better understanding of developers.

Share on facebook
Facebook
Share on twitter
Twitter
Share on linkedin
LinkedIn
Shopping Basket